
The platform automatically gathers telemetry across your entire hub. Use a single interface to monitor workloads, web traffic, image builds, and more across on-prem and cloud.
(yaml)
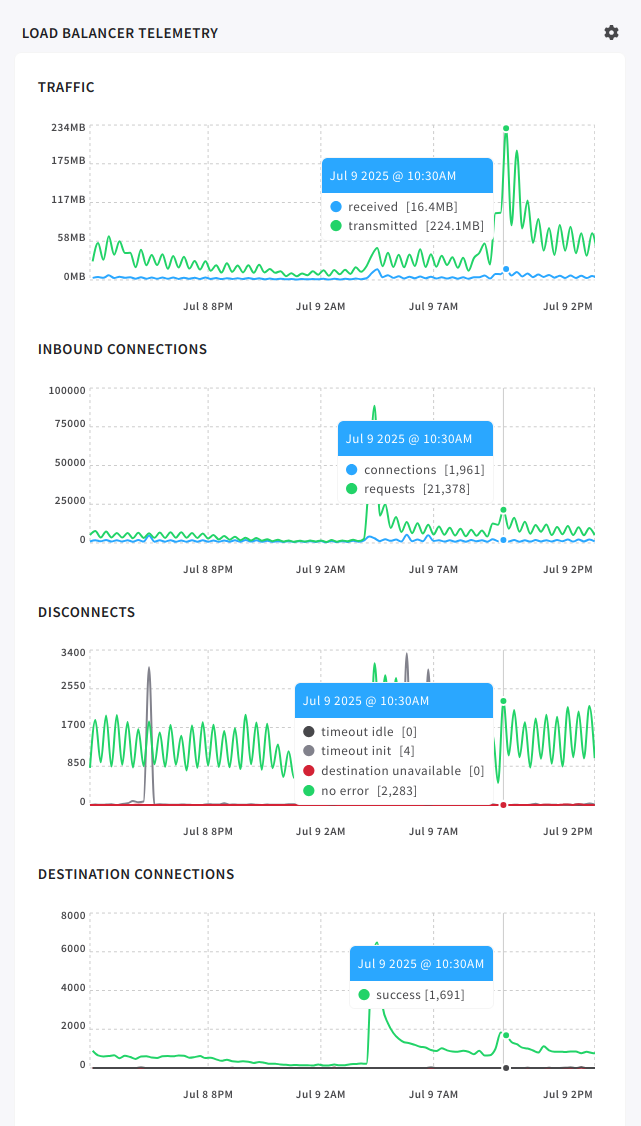
metrics:
	- infrastructure.resources.cpu.usage.system
	- lb.controller.requests.url.handlers.redirect.timing_ms
	- pipeline.runs.num
	- discovery.resolutions.cache_hits
	- lb.controller.router.destinations.requests.total
	- images.storage_kb
	- infrastructure.resources.ram.free_kb
	- lb.controller.disconnects.no_error
	- environment.containers.num
- memberships.numThe ability to parse data is as important as having it. The portal is packed with charts, graphs, and visual aides to enable easy, accurate parsing of your ecosystem.
Include custom metrics delivered by your container instances via the Internal API. Track any application level data imaginable, and visualize it alongside automatically gathered telemetry.
(bash)
curl --unix-socket /var/run/cycle/api/api.sock http://localhost/v1/monitoring/metrics \
  --request POST \
  --header 'Content-Type: application/json' \
  --header 'X-CYCLE-TOKEN: <Internal API Token>' \
  --data '[
  {
    "metric": "application.uploads.minute",
    "type": "counter",
    "labels": {
	  "type": "png"
    },
    "tags": [
      "website",
	  "storage"
    ],
    "points": [
      {
        "time": "2025-01-30T08:30:00Z",
        "values": [
          413
        ]
      }
    ]
  }
]'Cycle continuously monitors activity across your hub — tracking team access, security events, web traffic, and approaching resource limits, so you're aware of critical issues before they become problems.
Using the Internal API, submit custom events from your code back to the platform.
(bash)
curl --unix-socket /var/run/cycle/api/api.sock http://localhost/v1/monitoring/events   --request POST   --header 'Content-Type: application/json'   --header 'X-CYCLE-TOKEN: YOUR_SECRET_TOKEN'   --data '[
  {
    "event": "internal.secret_rotation",
    "type": "info",
    "priority": "critical",
    "text": "Secrets for DB and API tokens were rotated successfully",
    "extra": {
      "rotated": ["db_password", "api_token"],
      "rotation_strategy": "cycle-managed"
    },
    "labels": {
      "team": "platform",
      "environment": "production"
    },
    "tags": [
      "security",
      "infra",
      "internal"
    ]
  }
]'Logs are collected automatically from the container's stdout and stored locally on the server that runs the container for up to 14 days, and never written to servers that Cycle operates.
Logs are aggregated across all instances of a container, including regions, cloud providers and on-prem. Grab the context around when key phrases appear to easily identify and resolve issues.
[2025-07-03T22:00:00Z] [Service: auth] INFO: Starting user authentication flow
[2025-07-03T22:00:02Z] [Service: auth] ERROR: connection refused at 192.168.1.10:5432
[2025-07-03T22:01:17Z] [Service: auth] ERROR: connection refused after retry
[2025-07-03T22:15:00Z] [Service: analytics] DEBUG: Sending metrics batch
[2025-07-03T22:15:02Z] [Service: analytics] ERROR:connection refused to analytics-db
[2025-07-03T22:16:30Z] [Service: analytics] INFO: Metrics buffer cleared
[2025-07-03T22:16:32Z] [Service: analytics] ERROR:connection refused during backupShip container logs to an external URL or service for additional processing.
Your Compute
External Service


Cycle is so effective that we often forget about it. From time to time, they ping us to check if we need any help; most of the time, we don't. The infrastructure just works, so we can focus on building our features. They live up to their motto, 'LowOps DevOps.'

Galileo Sanchez, Lead Technologist @ GLUi
Instances and infrastructure scale up based on metrics like CPU, RAM, network throughput, and more.
Instances automatically upgrade to out-of-band networks if they become available.
The Cycle Loadbalancer removes unreachable instances from the pool until they check back in.
Remote access is locked down when suspicious behavior is detected.

website
.
web-frontend-01
of containernginx-proxy
.
prod-ch01-sv01
.All access and activity is logged. When something changes, you'll know exactly who did what, when.
We use first-party cookies to keep the site fast and secure, see which pages need improved, and remember little things to make your experience better. For more information, read our Privacy Policy.